6 min to read
Top FaaS Observability Platforms In 2019

Let’s take a walk down memory lane. The year is 2018, AWS Lambda is already kicking and securing its position in the serverless world. Like Microsoft Azure Functions and Google Cloud Functions, Amazon Web Services held their place among the best serverless computing platforms in the World.
When we think of function-as-a-service (FaaS), we know how important it is for developers to have control over their work. Monitoring and following up with changes in your functions is of the utmost importance. Therefore, observability platforms became another crucial element needed for successful development without too much stress.
After looking at what is serverless architecture and how to build a simple API with Nodejs and AWS Lambda, you probably started to get an idea of how big serverless can be, but to actually use it in production you’ll have to find a good solution for bringing observability to your stack since, by default, you have none. So to understand what’s going on behind the scenes you’ll have to employ some tactics you might not be too familiar with.
In this article, I’ll walk you through the top FaaS observability platforms in 2019, and we’d like to invite you to a discussion on this topic in our comment section below.
What Is FaaS?
FaaS is a computer cloud service or an online platform, if you will, that allows its users to run, develop, and manage their applications remotely. The vital part you should know, if you are using FaaS, is you don’t need to build any kind of infrastructure, or perform complex maintenance. That’s what gives it the edge over all other solutions. You can find a more detailed article about the “What Is FaaS?” on our Dashbird blog page.Now, when you’re already familiar with the function-as-a-service model, let’s dig in a bit deeper.
FaaS Observability Platforms
Let’s say you’re already developing an app, and everything is working as it should, but then you encounter an issue; like a request didn’t get the right response or it didn’t fire at all. In that case, what you would need to do is to go through your entire code, looking for an error, or rely on Cloudwatch to pin point the problem.
If you’ve ever had an app in production, with thousands of invocations, you probably know that Cloudwatch doesn’t do well with volume and finding the culprit can be a daunting task.
There are various monitoring and observability platforms that can keep tabs on your function’s progress, and they’ll let you know if anything goes sideways. Today we’ll mention some of the best FaaS observability platforms in 2019.
Dashbird

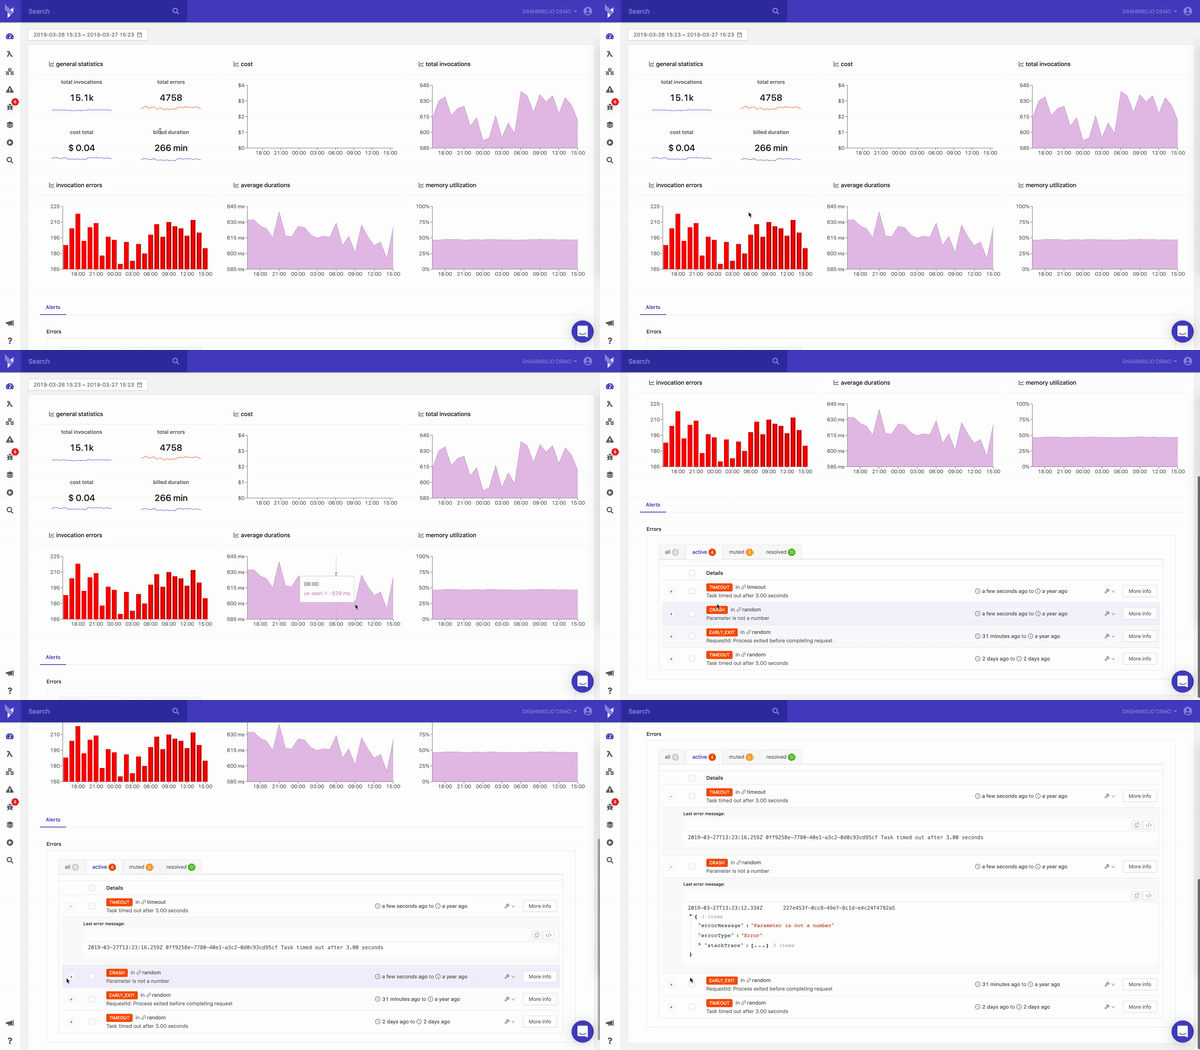
Dashbird is a serverless observability platform that stands out significantly because of the platform’s ease of use, user-friendly interface, quality, and exceptional management. To use the Dashbird’s platform, there’s no changing your Lambdas whatsoever.
The one thing you’ll need to do is to deploy a CloudFormation preconfigured template.
Dashbird can detect and fix any problem in minutes, giving you peace of mind. It can manage serverless applications that are in the development and at scale.
Giving you a better insight into your serverless applications means that Dashbird has a more in-depth insight into serverless. It gives you a possibility to find bottlenecks, as well as to visualize usage of resources. If you think of cost optimization and speed, Dashbird offers excellent solutions like showing precisely what caused a function to go slow and it also can identify segments of systems that cost the most.
Debugging as well as error alerting is among the most critical features that Dashbird has to offer to its users. When talking about the resilience, you should know that understanding the root cause of an anomaly, or an error, fast is quite a significant perk, and Dashbird can do it for you.
IOpipe

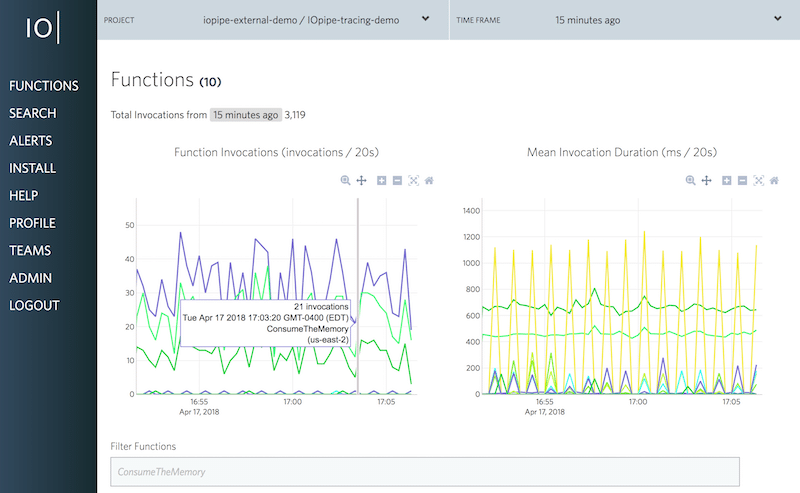
Another excellent function observability platform is IOpipe. It allows you to look into serverless applications when broken down into dozens or even hundreds of functions. IOpipe releases you of file digging and log searching. Seeing your function’s behavior, IOpipe can determine if there are errors in your function(s) and how to debug them. You’ll be notified instantly, and the monitoring will continue after the issue has been solved.
IOpipe works in real-time meaning there’s no lag time and there’s no need for you to test your functions to see if there are errors. As soon as something comes up, IOpipe will investigate, take action, and inform you of any changes in log files.
Profiling allows its users to see quickly, line by line, where their code is running and for how long - meaning there’s no more need to wait for logs to show up.
Tracing is another tool that allows users to have a visual confirmation of what’s taking up so much time, and why, inside every invocation. If it’s reading an object from S3 or even writing a value into DynamoDB, you’ll know exactly what’s going on and why.
One of the main differentiators is that IOPipe warps the function and that means you’ll have to edit each function in order to get the logs. They, however, do have a solution that will make wrapping your functions a lot easier.
Epsagon

Epsagon is coming as a third choice in the top observability platforms since it offers automated monitoring and troubleshooting for modern applications. Epsagon allows its users to search through every trace, log, and payload thus saving countless hours of digging through Cloudwatch logs.
Another essential thing to know about Epsagon is that it’s agentless - meaning you are able to run it across all production workloads (AWS Lambda, containers, AWS Fargate, Kubernetes, etc.) Epsagon’s distributed visualisation and tracing gives you a visual insight into everything that’s going on inside your functions. It makes sure that your application looks and behaves like you’ve intended.
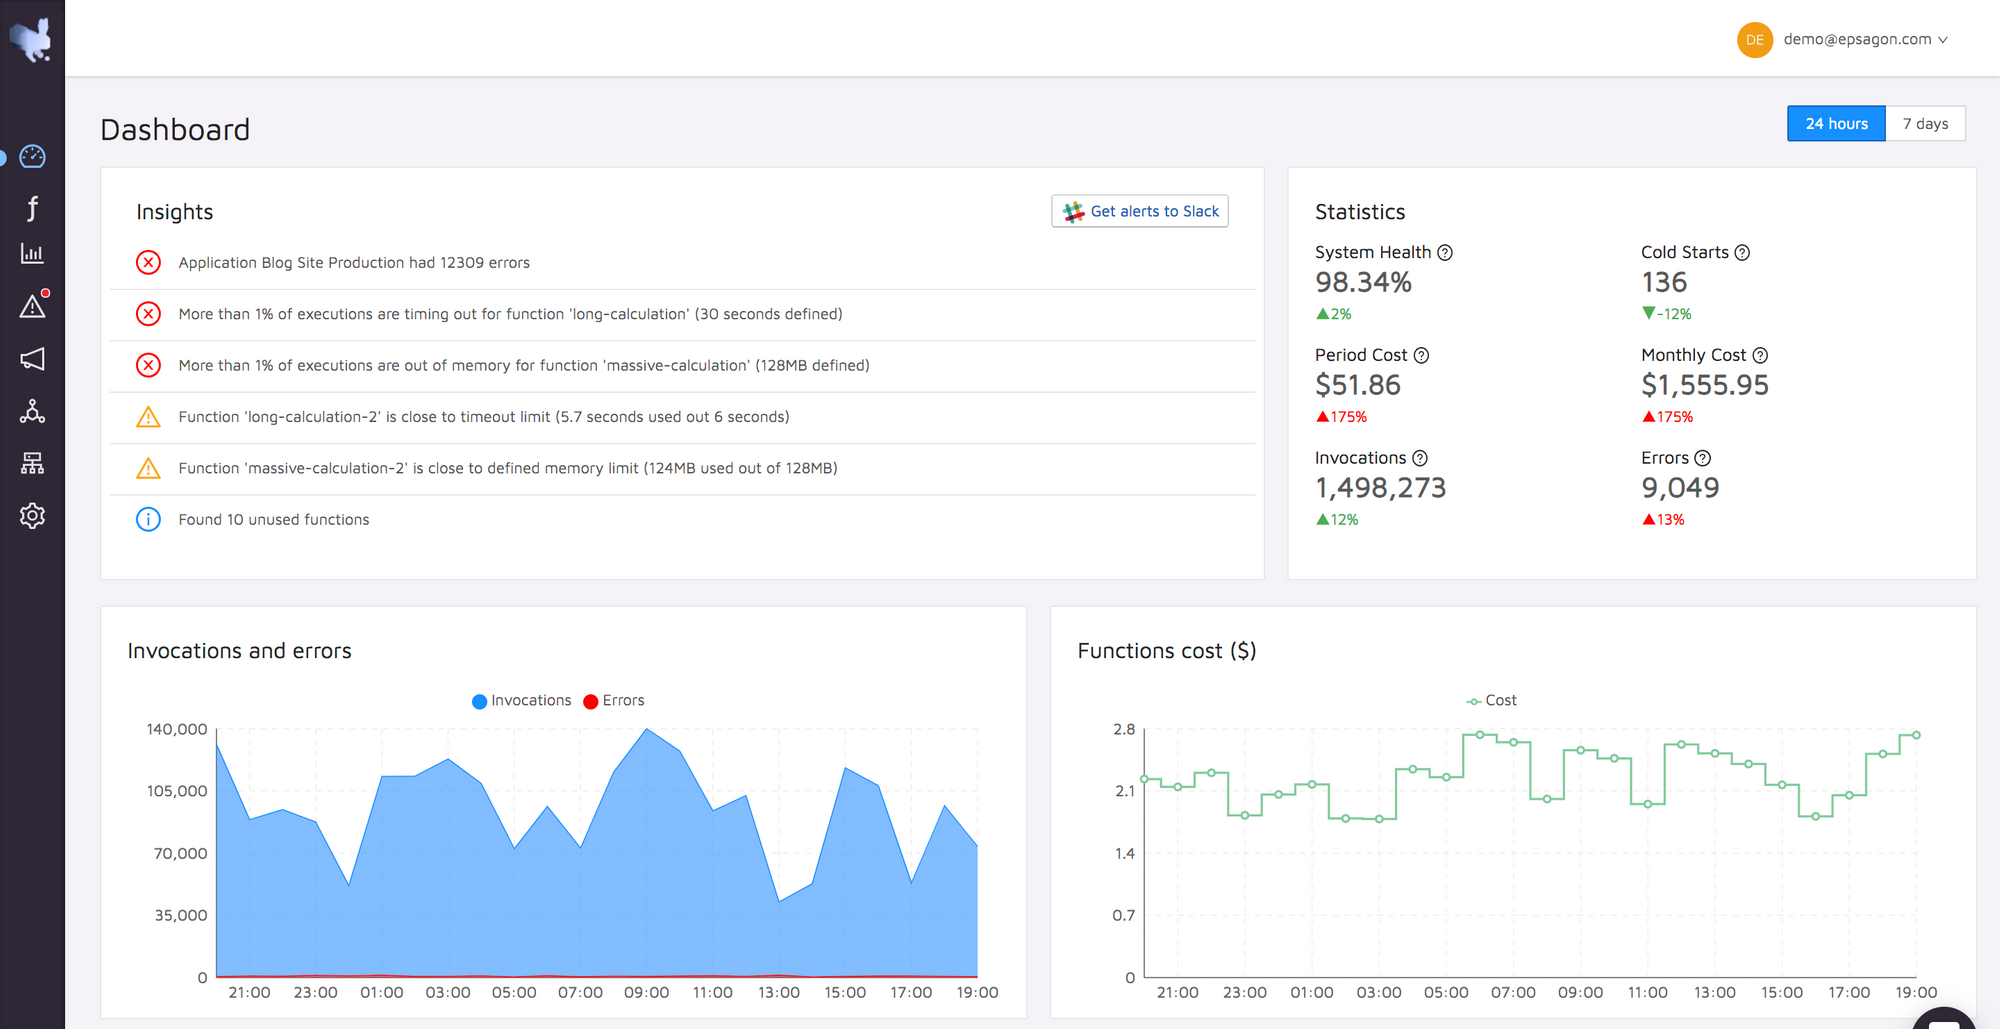
Epsagon also has a monitoring dashboard where you can see all that’s going on inside your stack at any given time. The notification manager will let you know if any changes occurred in realtime. Epsagon also has an issue manager that provides an overview of all the issues that happened inside your functions.
The Road So Far
As we’ve seen so far, all three FaaS observability platforms have their own perks and all three work great. There are differences between them that you’ll have to distinguish yourself. Knowing your needs is half the work done.
Another great way to understand the different particularities of each observability platform is to look at user feedback.
If you have had the pleasure of testing any of these platforms please share your thoughts below.
Comments